A classroom/laboratory activity to analyze CO2 emissions data by using Riemann sums for the calculation of area under the curve.
Students will use calculate and compare CO2 emissions for the U.S. and China, based on emission and population data for the period 1980-2015. They will use Riemann sums to calculate the area under the curve. They will also create a proposal for emission reduction by considering past and current CO2 emissions for the two countries.
Use this tool to help students find answers to:
- Calculate the total CO2 emissions for China from 1980 to 2015 (data records provided in the activity) by using left Riemann sum and right Riemann sum. Compare the two values obtained.
- Using Riemann sums, compare the total CO2 emissions (data records provided in the activity) for the U.S. and China from 1980 to 2015.
- What are the possible effects of these CO2 emissions on the Earth’s climate?
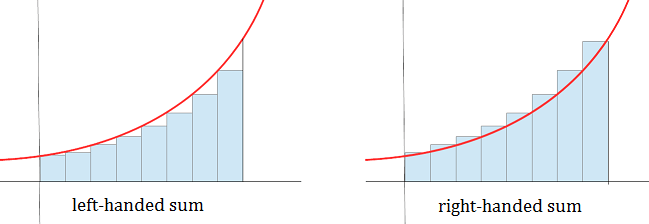
Image credit: Mathematics Stack Exchange