Mosquitoes and malaria

Laboratory Activity

A classroom/laboratory activity to establish the potential link between the geographic distribution of malaria and increasing temperature caused by climate change.

Students will use maps and temperature data sheets to determine the locations where malaria is known to occur and the temperature ranges in these locations. Further, they will discuss and explore the potential impact of climate change and the resulting change in temperature on the geographic distribution of malaria.

Use this tool to help your students find answers to:

  1. What are the factors that influence the distribution and spread of malaria?
  2. How could a change in the average global temperature affect the geographic distribution of malaria?
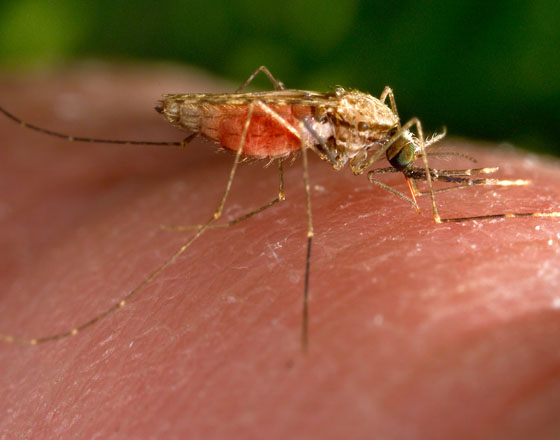
Image credit: ??

Visit Tool

By Carl W. Bollwinkel, in collaboration with Barbara A. Bonnett, Rosalie J. Cochran, Center for Energy and Environmental Education, University of Northern Iowa, Cedar Falls, IA; and Craig Zoellner, North Iowa Area Community College, Cedar Falls, IA. Prepared in 2002 by Stacey Rudolph, Senior Science Education Specialist, The Institute for Global Environmental Strategies (IGES), Arlington, VA. Graphic Design by Susie Duckworth. Updated March 2008 by Theresa Schwerin, Associate Director, Education, IGES.

Hosted at Institute for Global Environmental Strategies


Language: English

Location: North America, USA, Caribbean countries

Grade: High School

Access: Online, offline

Computer Skills: Basic


Discipline: Biology

Discipline Topics: Malaria, Plasmodium, Protozoa, Vector-borne Diseases, Climate Change and the Spread of Malaria, Epidemiology

Climate Topics: Climate and Health