An interactive visualization to observe and understand the possible effects of sea-level rise and different storm scenarios on the coast of California.
Students will configure parameters such as the amount of sea-level rise and the frequency of storm scenarios to observe the corresponding effects on specific locations along the Californian coast. They will compare and discuss various flooding scenarios and the vulnerability of different locations.
Use this tool to help your students find answers to:
- What is the possible impact of a sea-level rise of 200 cm on Southern California?
- Discuss the flooding potential of Northern California for a sea-level rise of 500 cm.
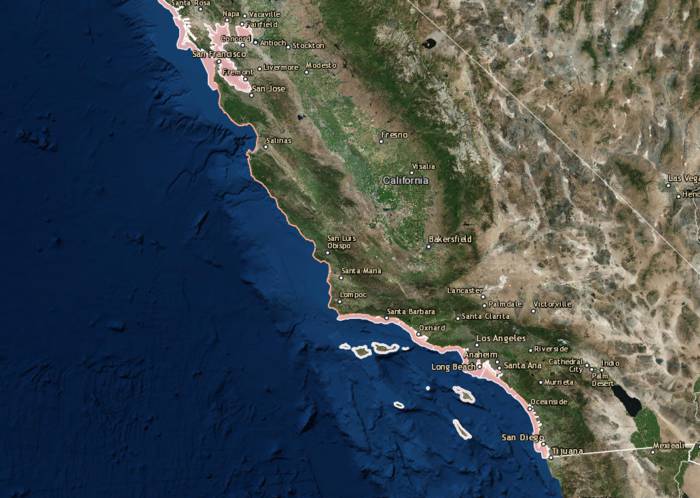
Image credit: Our Coast Our Future (OCOF)